

A blood pressure monitor remembers a number. A useful log remembers the circumstances around it. Was the reading before breakfast or after a night shift? Was it the first measurement or the second? Did you sit quietly first? Those details can give a clinician a clearer view than a remembered range of “usually fine” or “sometimes high.”
This blood pressure log and trend tracker is a private browser tool for recording home measurements, viewing the systolic and diastolic lines over time, downloading a CSV and printing a visit-ready page. It stores entries in this browser only. It does not diagnose high blood pressure, adjust medicines or replace clinical advice.
Blood pressure log and trend tracker
Add one careful measurement at a time. You can record the first and second readings from a session as separate entries. The chart shows the stored values; it does not interpret them as a diagnosis.
Entries are saved in this browser using local storage. They are not sent to osvilt.com. Use a private device or clear the log after printing if other people use this browser.
- Readings shown
- 0
- Average systolic
- —
- Average diastolic
- —
SystolicDiastolic
| Date | Time | Blood pressure | Pulse | Context | Action |
|---|
Your saved readings will appear here.
Why keep a blood pressure log?
Home readings can capture patterns that are missed by a short appointment. They can also be distorted by ordinary life. Coffee, smoking, exercise, alcohol, a full bladder, anxiety, an unsupported arm or talking during the measurement may affect the result. That is why a brief note beside a reading can matter. “After a rushed walk” and “seated quietly for five minutes” describe very different data points.
The CDC encourages people using self-measured blood pressure monitoring to use a log, measure at the same time each day and take at least two readings one or two minutes apart. The American Heart Association also recommends recording two readings one minute apart. Saving both values is more useful than keeping only the lower one. Natural variation is part of the information.
How to get a useful home reading
Use an automatic upper-arm cuff monitor that fits your arm. Wrist and finger monitors are less reliable for most people. The exact model matters: a monitor should be clinically validated, and the cuff should match your upper-arm size. The American Heart Association points readers to ValidateBP for a U.S. list of devices tested against published validation criteria. A pharmacist or clinician can help identify suitable options where you live.
- Avoid smoking, caffeinated drinks and exercise for 30 minutes before measuring. Empty your bladder first.
- Sit in a chair with your back supported, feet flat and legs uncrossed. Rest quietly for at least five minutes.
- Put the cuff on bare skin above the elbow crease. Rest your arm on a table so the cuff is at heart level.
- Stay still and do not talk. Take a second reading one minute later, then record both values and any useful context.
Use the same routine each time wherever you can. A series taken under similar conditions is easier to compare. Bring the monitor to an appointment at least once so a healthcare professional can check the cuff fit, your technique and whether the device aligns with office equipment.
How to use the trend chart
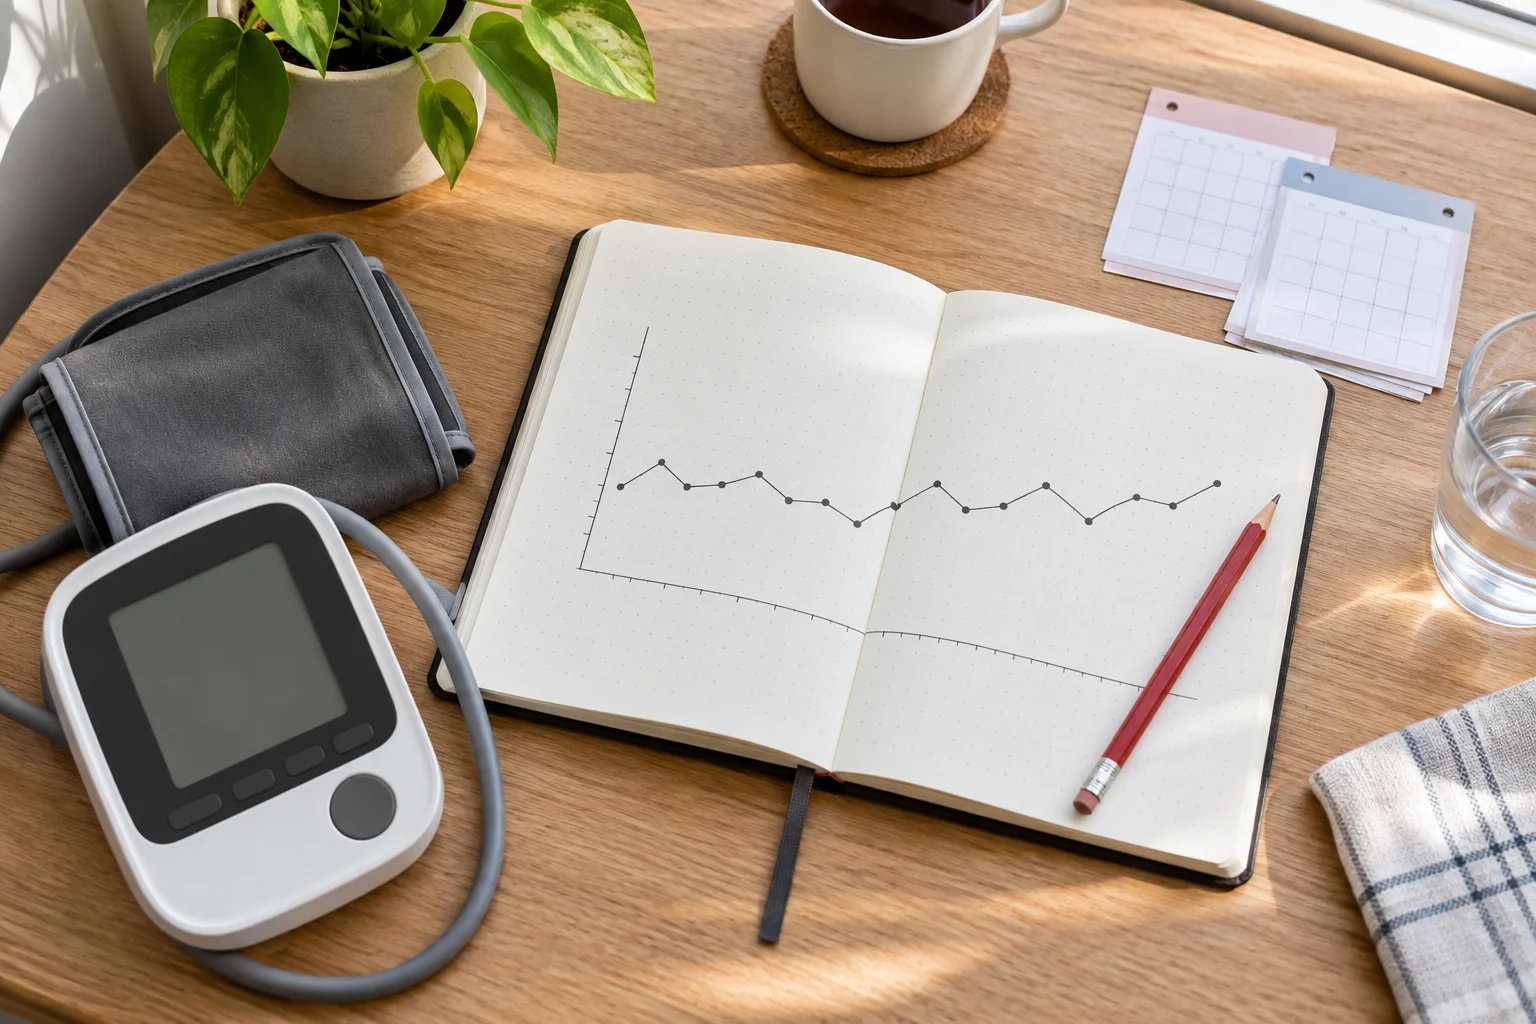
The red line is systolic pressure, the top number. The blue line is diastolic pressure, the bottom number. A line chart makes it easier to notice a run of higher readings, a consistent morning-evening difference or a change after a routine changes. It cannot explain why the pattern appeared. Your notes, medical history, medicines and symptoms still matter.
The shown average is simple arithmetic for the currently selected readings. It is a summary, not a clinical verdict. NICE uses a more specific process when home monitoring is being used to help confirm hypertension: two consecutive seated readings, twice daily, for at least four days and ideally seven, with first-day readings discarded before averaging the rest. Use that formal method when a clinician asks for it. This tracker keeps every saved entry visible, including first-day readings, because the full record remains useful.
Keep the individual values. A comfortable-looking average can conceal a very high reading, and a single unusual measurement can pull a short average upward. A clinician can make better sense of the pattern when they can see dates, times and the original pair of numbers.
What to bring to a clinical visit
Use the CSV download when a clinician, pharmacist or telehealth service asks for a file. Use print when paper is easier. The printed summary includes the selected period, the chart, the averages and the saved table. Consider bringing your monitor too. A comparison with clinic equipment may reveal an incorrect cuff size, a positioning issue or a device that needs replacing.
Include a short context note only when it changes the meaning of the reading: “before medicine,” “missed dose,” “headache,” “after overnight shift” or “first of two readings.” Avoid turning the log into a diary of every feeling. Specific notes are easier to scan and discuss.
When a log is not enough
A planned log is for non-emergency monitoring. The American Heart Association advises repeating a reading above 180/120 mm Hg after at least one minute. If it remains that high, contact a healthcare professional immediately. Do not wait for several days of data, and do not change a prescribed dose on your own.
Call local emergency services when a reading above 180/120 mm Hg occurs with chest pain, shortness of breath, back pain, numbness, weakness, change in vision or difficulty speaking. Seek emergency help for severe symptoms even when you have not measured your blood pressure. A chart cannot assess an emergency.
Frequently asked questions
How often should I save a reading?
Follow the schedule from your healthcare team. CDC and AHA guidance commonly describes two readings taken one or two minutes apart at the same time of day. A clinician may set a different plan for pregnancy, medication changes or a specific condition.
Does the log leave my browser?
No. Saved entries use browser local storage on the device where they were added. The download and print actions are started by you. Clear the log after use on a shared computer.
Can I use the average to diagnose hypertension?
No. A diagnosis requires valid measurements and clinical interpretation. The tool can organize numbers for that conversation.
Why do two readings from the same session differ?
Small differences are common. Record both readings. A repeated large difference is a reason to check technique, cuff fit and the monitor with a clinician.
Sources reviewed
- American Heart Association: Home blood pressure monitoring
- CDC: Measuring your blood pressure
- NICE NG136: Hypertension in adults
- ValidateBP: Validated blood pressure devices


